Enable Account Activity Alerts to Level Up Your Financial Super Powers
How setting up spending alerts on your credit and debit cards can give you new personal finance super powers.

How setting up spending alerts on your credit and debit cards can give you new personal finance super powers.

Are the paper products you use made from Virgin pulp from old-growth forests? After learning the facts, we’ve changed our buying habits.
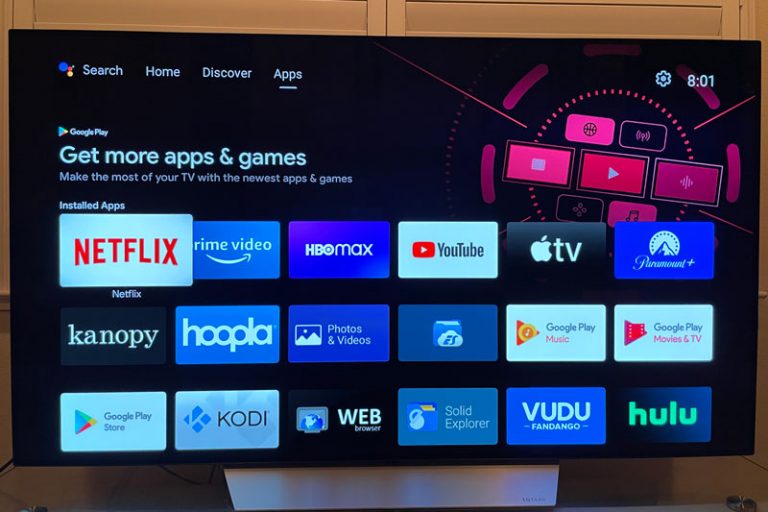
Want to pay less for streaming? Learn easy ways to save money on streaming services with regularly updated tips & tricks.
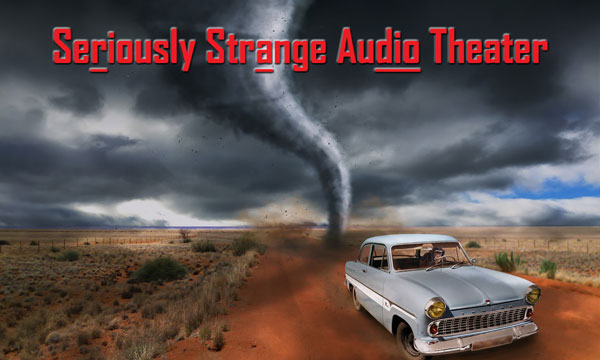
A story about how Financial Independence can open unexpected doors and lead to “accidental” opportunities — such as co-founding a new Audio Theater troupe.

Some ideas, crowd-sourced from the ChooseFI community, for how to watch the final season of Game of Thrones on the cheap.
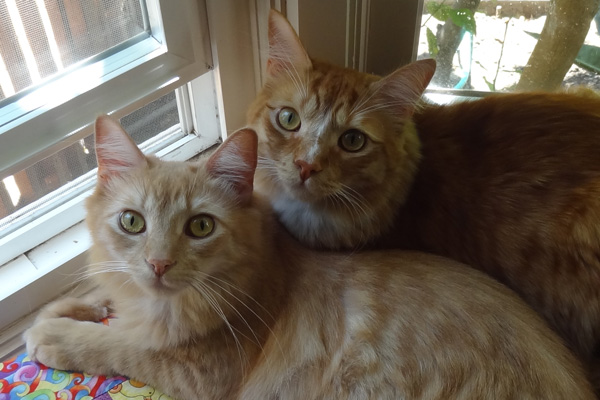
Hear what happens when Cats On Fire, Milo and Toby, join Dogathan Mendosa and Bird Barrett on the Choose FI Radio Podcast.

A review of 26 impactful tweaks you can make in 2019 to improve your financial life, as suggested by Paula Pant of Afford Anything.

Regardless of your thoughts about timeshare ownership, attending timeshare presentations can be a money saving travel hacking technique.

An exploration of what the FIRE movement and community has in common with Star Trek, especially in core values and life philosophy.

Milo, cat on FIRE, offers a list of his 7 pillars of living frugality on the journey towards Feline Indifference Rest Everyday.